Reporting
Welcome to the Department of Medicine Reporting Services page.
This page is designed for the internal client and groups with secure server access. In a continued effort to provide quick access to information and web based tools, this site supplies a number of resources directly to you.
These resources include Epic Professional Billing (PB) reporting links from a variety of sources including Slicer Dicer, WebI, Cubes, Prism Portal, Power BI, etc.
- Does NOT include Hospital Billing (HB)
- Includes Department of Medicine data only
- Data from the inception of Epic-July 2018
- These links are available only with appropriate security roles.

SlicerDicer is a self-service reporting tool that provides physicians, department managers, and other users with intuitive and customizable data exploration abilities. Using SlicerDicer, users can find the data they need to investigate a hunch, and then refine their searches on the fly to better understand the data they work with. Right in Hyperspace, they can examine trends, drill down to line-level details, and jump to related records to follow up.*
With SlicerDicer, users can search for free text in lab results, combine similar elements on the fly, and jump into patient charts.* If you’re not sure where to start, enter a keyword and select from a list of suggested search criteria. Then, choose a visualization that matches your needs, including vertical and horizontal bar graphs, line graphs, maps, and tree map charts. SlicerDicer can show results using a variety of different measures, including totals, percentages, averages, variance, maximums, and minimums.
* With appropriate approvals and permissions, you can view patient details and export data in SlicerDicer for Quality Improvement purposes.
To access this tool login to Epic and choose the “SlicerDicer” icon in your Epic toolbar. If you do not see the icon, use the magnifying glass to search for “SlicerDicer”. To obtain access or to add additional data models, please put in a ticket thru ServiceNow here.

Introduction to SlicerDicer for Revenue Applications [REV151] [9:06 minutes]
This video provides a basic overview of SlicerDicer. It shows how to slice the data in multiple ways, adjust the way the data is displayed and narrow the data by date range. It will also show how to dig deeper into data in SlicerDicer.
Saving and Sharing SlicerDicer Sessions [REV152] [7:57 minutes]
Learn how to save SlicerDicer sessions and share those sessions with others. This video also shows how to adjust the date range, change the visual options, grab the top ten and change the way the data is measured. You will also learn how to add a SlicerDicer session as a component to your personal view of a dashboard.
Prism Portal houses the 3 standard Epic CUBES (Transaction, AR and Denials).
You must cut and paste this link – file://fppws01.fpp.wucon.wustl.edu/PBS%20Reports/ into YOUR BROWSER. This Reporting is only available through your browser.
Epic Cubes are structures of pre-aggregated data that allow users to split data quickly and generate an understandable visual representation. They can be used to track trends over long periods of time, aggregate data based on a particular procedure code, or to see high level AR summaries. These reports are ideal for Ad-Hoc, self-service reporting in a variety of applications. Here are a few key things to know about Cubes:
- There are three different Cubes files: Transactions, AR, and Denials
- Cubes are stored within Prism Portal.
- The data that the file accesses is updated every Sunday.
- The files can only access information dating back to June 2nd, 2018 that is from Epic.
- These files do not access live data – users are free to adjust these files as they would like and save them.
- Only users who have access to Cubes will be able to update the files. Sharing the file with someone who does not have access will allow them to view the current data, but they are unable to change any settings.
- Microsoft Excel 2013 or newer is required to use the files.
- Training provided by FPP.
Physicians and APPs will access to their own Signal data directly from Epic Hyperspace via an added Signal button on their Epic tool bar. Signal will allow providers access to their Epic Metrics.
Signal helps you take a data-driven approach to measuring provider efficiency with Epic, both within your organization and across the Epic community. Compare groups within your organization to each other or compare your metrics to the Epic community average to help identify the most important workflows to target for efficiency improvements.
Signal shows how your providers are using Epic in four key areas—In Basket (for inpatient providers, Communications), Orders, Notes & Letters (for inpatient providers, Notes), and Clinical Review—and suggests features and configuration options to increase efficiency in each area based on your data. Suggestions are easily actionable and personalized to your organization’s needs.
Signal includes two levels of data:
- The Summary view shows organization-wide data. It helps leaders, analysts, and informatics see larger efficiency trends across specialties and your entire healthcare system. You can choose between the EpicCare Ambulatory and EpicCare Inpatient views in the upper- right corner of the screen.
- The Provider view drills down to individual provider data. It helps trainers and others who assist providers one-on-one to provide personalized guidance based on system usage patterns. This view is currently available only for ambulatory providers.
WebI will be discontinued May 2024.
To access this tool login to Epic and choose the “BI portal” icon in your Epic toolbar. If you do not see the icon, use the magnifying glass to search for “BI Portal”. To obtain access or to add additional data models, please put in a ticket thru ServiceNow. Please note only Tier 4 users can access WebI.

Web Intelligence (WebI) is an interactive reporting tool offered by SAP BusinessObjects. It enables you to create reports on an ad hoc basis using information in your organization’s database. BusinessObjects universes are the basis for report writing in WebI.
A universe is a user-friendly, logical layer on a database. Each Epic-released universe organizes information about a particular topic, such as hospital billing transactions, and presents that information using straightforward business terms that make it easy for you to find what you want to report on. Universes enable you to create and view reports without having to understand the structural complexities of the underlying database.
Beginning March 28, 2023, the WebI launch from Hyperspace will no longer be available. To access Webi you will have to utilize the URL via a web browser: PRD BI launch pad (epichosted.com).
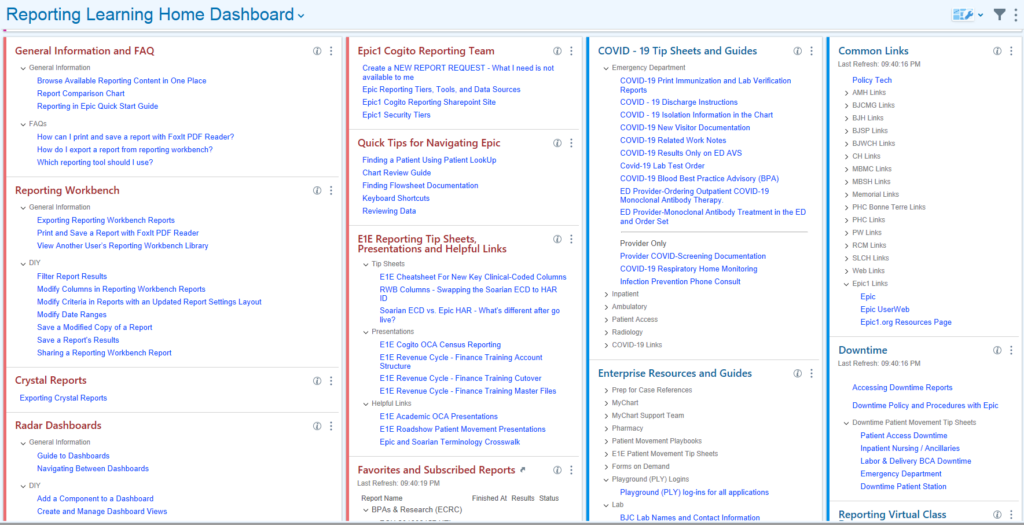
There are BJC and WU specific tip sheets available to help with this transition: BJC Authentication Directions for Webi and WU Authentication Directions for Webi. The URL link, as well as the helpful documents, are also available on the Reporting Learning Home Dashboard in the Webi component at the bottom of the dashboard.


Reporting Workbench is a Business Intelligence tool that Epic has included in their Cogito Analytics module. Reporting Workbench (RWB) reports are reports that display both rows of data, and can also display charts and graphs. RWB reports are also known as ‘My Reports’ as that is how you will find them in Epic’s navigation.
RWB reports can be sorted and filtered by end users. They can be customized and shared with peers as private reports. The records in the report are often patient records that can be acted upon in such ways as jumping into the patient’s chart, sending the patient a MyChart message, or placing a bulk order for selected patients. Find RWB reports you have access to in Hyperspace by navigating to the Analytics Catalog.
RWB reports use Chronicles as their main source of data, which is real time, and these reports are generally best to run for small windows of time (e.g. one month, one week, etc). RWB reports can be built using inclusion criteria that is run against Clarity and Caboodle data sources which allows for more records to be included in the report. Epic has created many foundation RWB reports that data consumers can review and request be implemented. Find these in Epic’s Report Repository. Note: you must first have an Epic Userweb account to access this catalog.
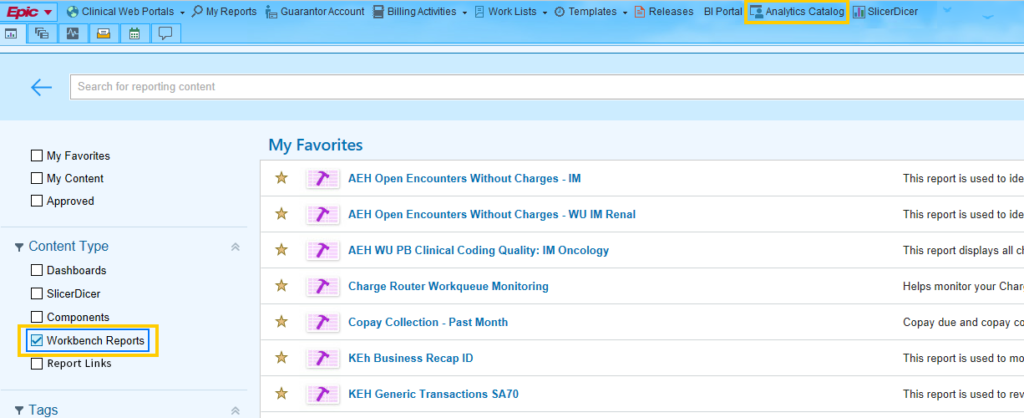
To access this tool login to Epic and choose the “Analytics Catalog” icon in your Epic toolbar. If you do not see the icon, use the magnifying glass to search for “Analytics Catalog”. Once in the Analytics Catalog, choose the “Workbench Reports” Content Type on the left. To obtain access or to add additional reports, please put in a ticket thru ServiceNow here.

Prism Portal houses the “standard” reports such as AR reports, Controllable losses and Lag Days in division specific folders. It also houses the 3 standard Epic CUBES (transaction, AR and denials).
You must cut and paste this link – file://fppws01.fpp.wucon.wustl.edu/PBS%20Reports/ into YOUR BROWSER. This Reporting is only available thru your browser.
DOM Dashboards
Developed by IMBO (contact Vamshi Gunturu – dom-imboreporting@email.wustl.edu)
FPP Dashboards
Developed by PBS (contact Andrea Herrell – herrella@wustl.edu):
Custom Reporting
For custom ad hoc report requests, please complete the following request form:
General Report Request for Department of Medicine (wustl.edu)
For more information, please contact the DOM Reporting Team at dom-imboreporting@email.wustl.edu.
Reporting Learning Home Dashboard in Epic

Research Reporting through Institute for Informatics (I2)
Informatics is the use of data-centric approaches to solve complex problems. This transdisciplinary field brings together doctors, scientists, professors, researchers and more in the pursuit of innovations in the healthcare and life sciences fields.
Informatics offers a way to harness and manage big data, leading to a number of benefits including an accelerated rate of scientific discovery, improved clinical decision making and the ability to promote healthy behaviors at a population level. The current Informatics Core Services rate is $150/hour.